# SyncoBox Clash Management
The SyncoBox clash Management module is designed to effectively assist teams in reviewing and resolving BIM model clashs encountered during the design process.
Using the clash dashboard, which combines an intuitive graphical interface with powerful statistical tools, users can quickly grasp the quantity, distribution, historical changes, and resolution progress of model clashes. This enhances efficiency and reduces design errors.
# Clash Dashboard
# Clash Manager
# Number of Issues by Zone
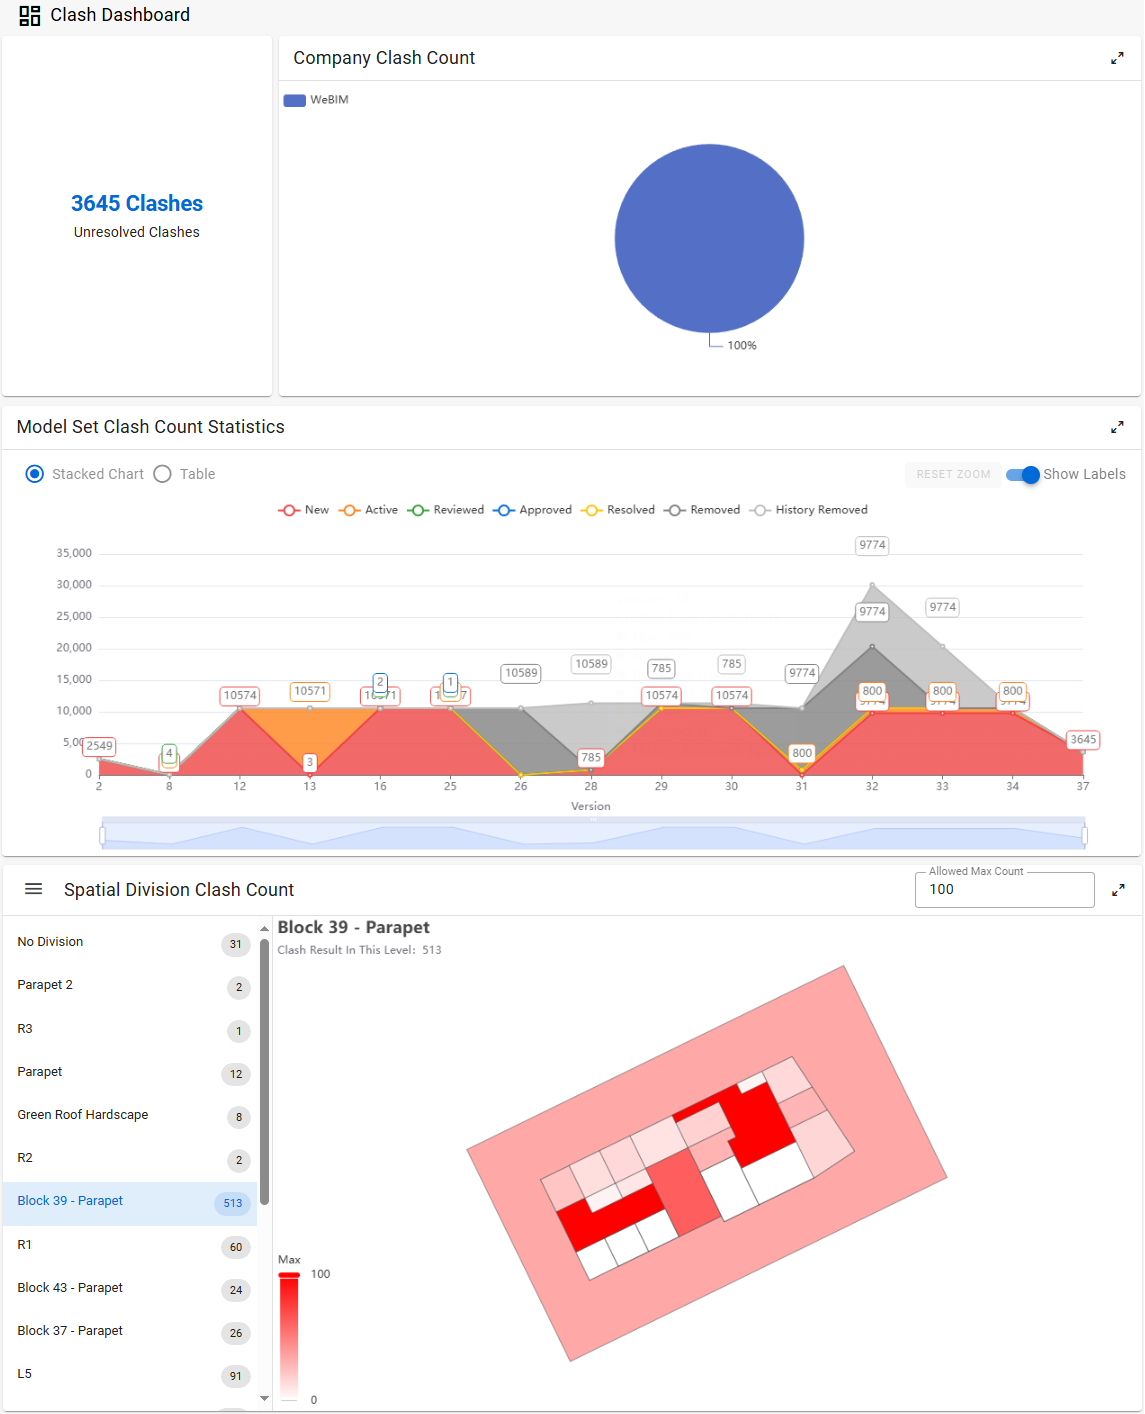
The top of the dashboard clearly displays the total number of clashes, providing teams with status updates to facilitate informed decision-making.
# Pie Chart
The pie chart illustrates the distribution of clashes by "Company," enabling users to quickly understand the proportion of clashs among various stakeholders.
# Model Set Clash Statistics
This chart compares clash data across different model set versions, clearly reflecting the resolution progress for each version.
Users can click "Clash Status Nodes" to expand or collapse relevant information, helping focus on key data.
Supports "mouse selection" for quickly reviewing specific data timeframes, offering greater flexibility in operation.
# Spatial Divition Clash Quantities
The system visually represents the number of clashes per division with varying shades of color; deeper red indicates division with higher clash intensity, facilitating quick identification of critical issues.
Users can click on the division list to switch displayed division and perform detailed analyses of division-specific clashes.
The parameter "Allowed Maximum Clash Quantity" at the top-right corner can be adjusted in real-time, providing a visual filtering condition.
# Clash Management
# Clash Manager
The Clash Management module is a core feature of the SyncoBox, displaying a list of model clashes within project zone. Through visual presentations, clash manager can understand model clashes, track resolution progress, and efficiently coordinate resources to ensure smooth design processes.
Log into the SyncoBox and select the corresponding project.
In the project menu, click [ BIM ]
 [ Clash Management ].
# Clash Condition Data
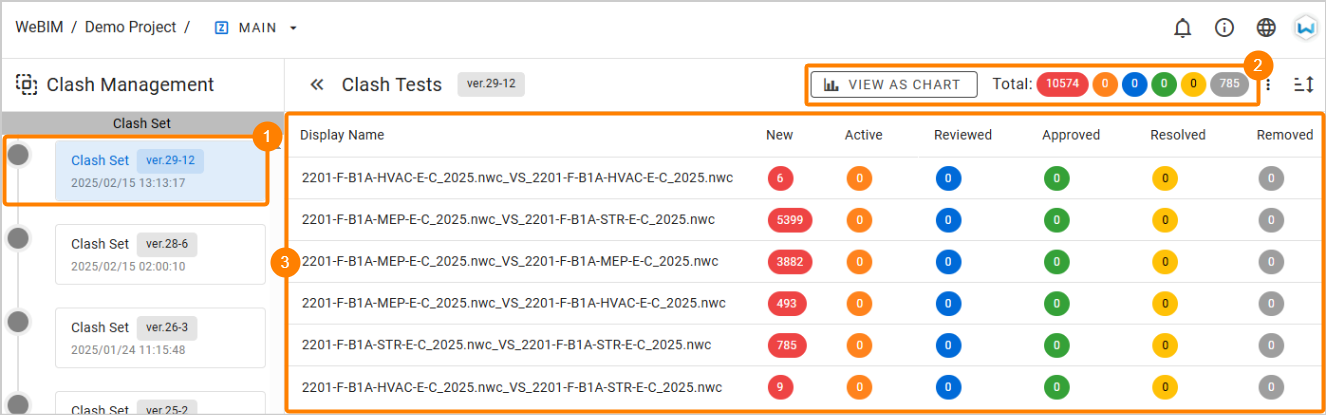
In the sidebar, left-click on the active 1 clash set.
TIP
Items marked with a are current active model set data.
Version numbers follow the format "Model Set Version - Clash Set Version" for easy identification.
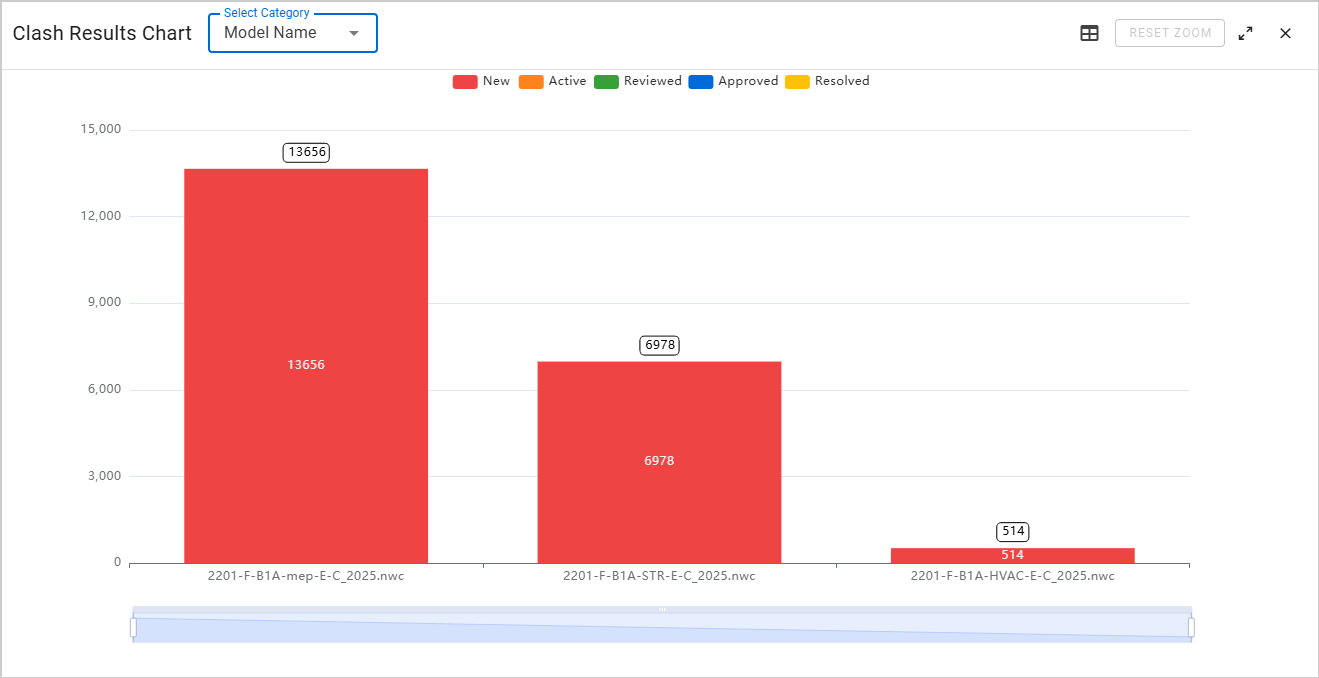
- The top-right corner displays 2 clash statistics for the current model set version. Clicking [ Chart View ] switches to the [ Clash Statistics Chart ] view. This chart supports categorization by model, spatioal division, or group and is displayed as a stacked bar chart.
- The list includes 3 clash test items and statistics; clicking a clash item reveals detailed clash result data.
# Clash Result Data
The clash results list provides comprehensive clash details, including clash name, status, group, assigned responsible person, grid location, model owner, and clash location.
TIP
For more information on spatial division management, please refer to the Spatial Division.
- Managers can directly edit clash status, group, and responsible owner in this list for progress updates.
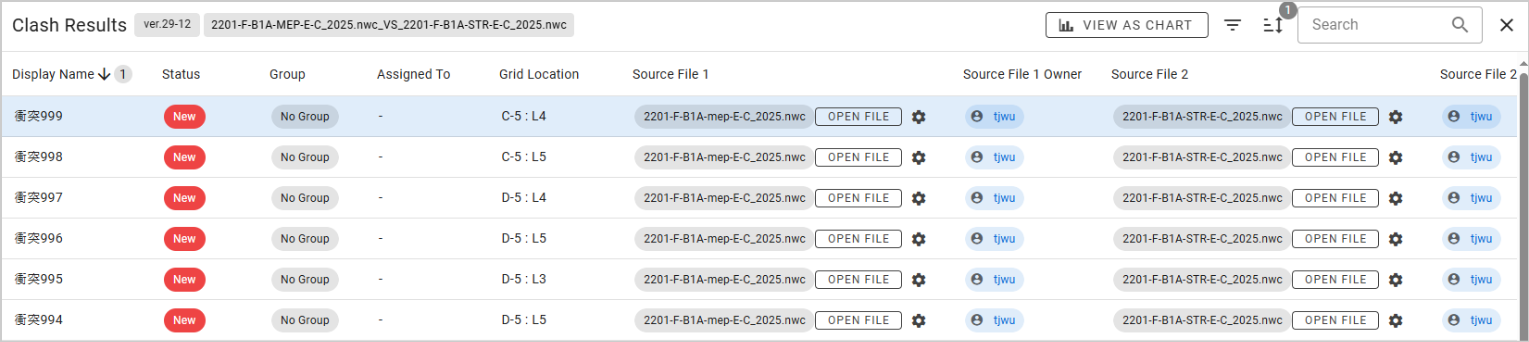
- Clicking any clash item opens a detailed information page, displaying clash images, overlap, and other relevant information.
# Dashboard
Log into the SyncoBox, and select the project.
In the project menu, click [ Overview ].
Switch between zones to display the zone overview, presenting clash data relevant to the user.
The zone overview includes User Clash Info, Company Clash Results, and stacked bar chart information for zone-specific clash data, as shown below.
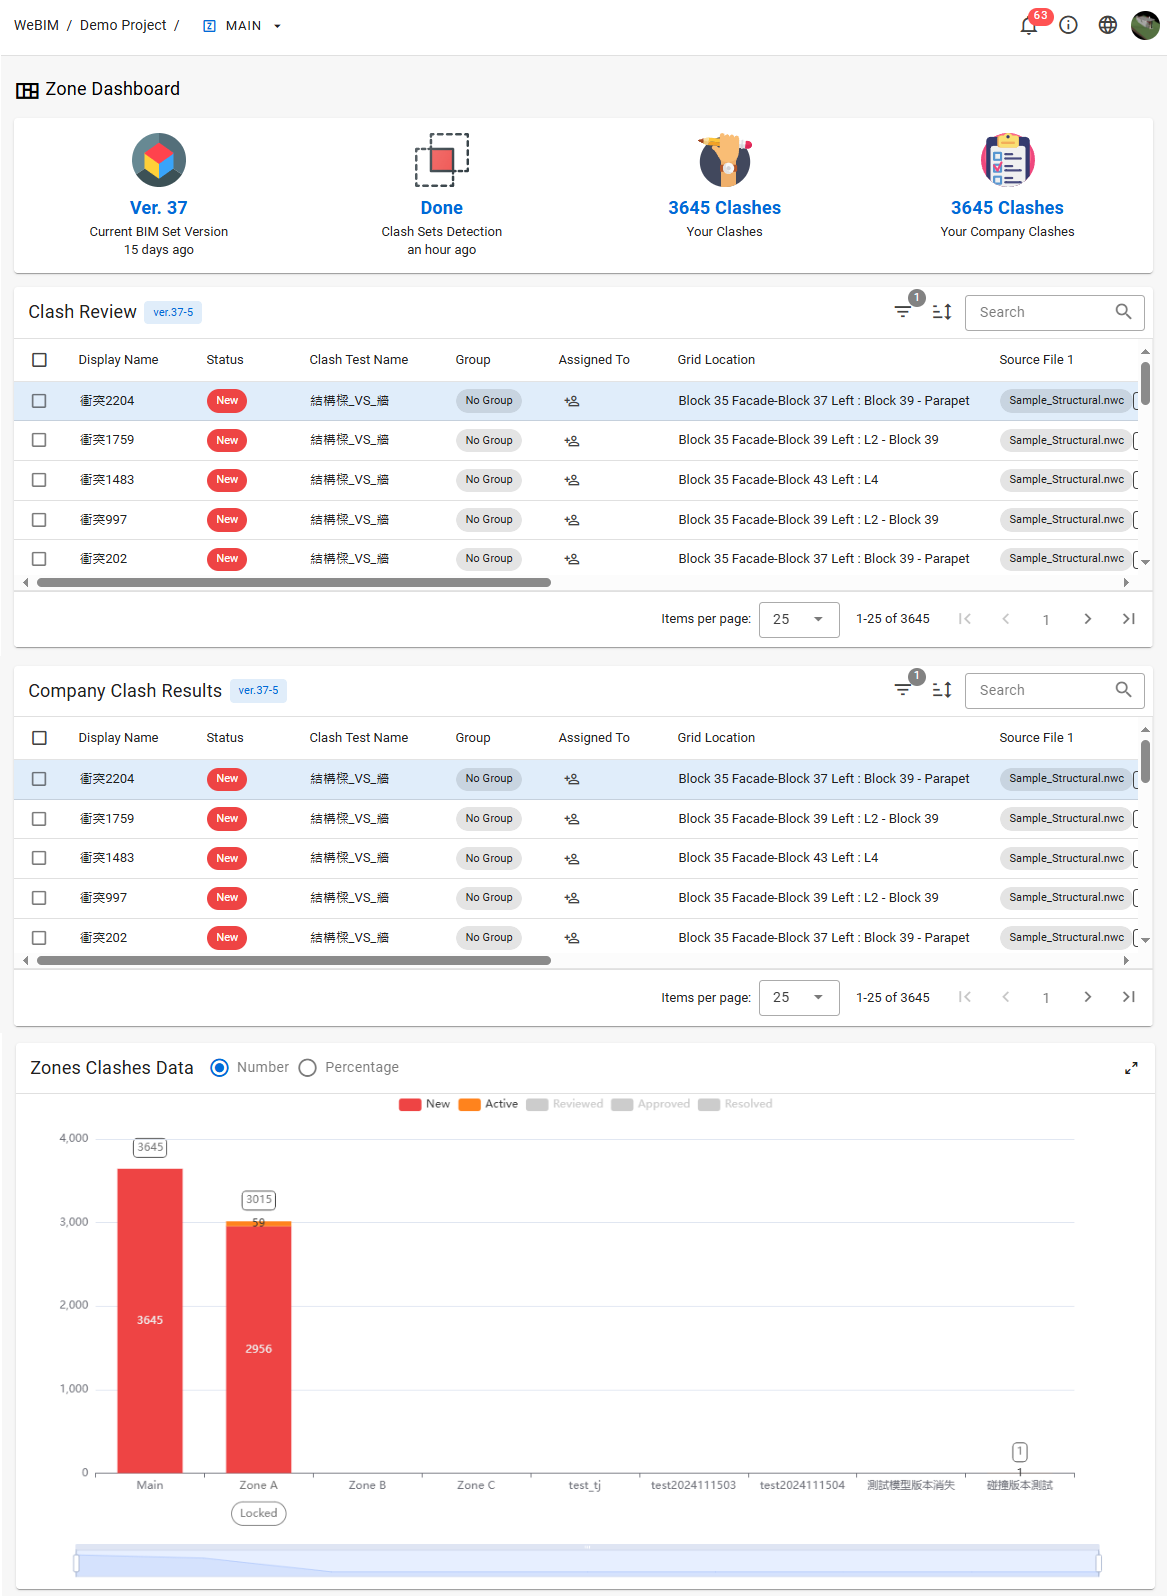
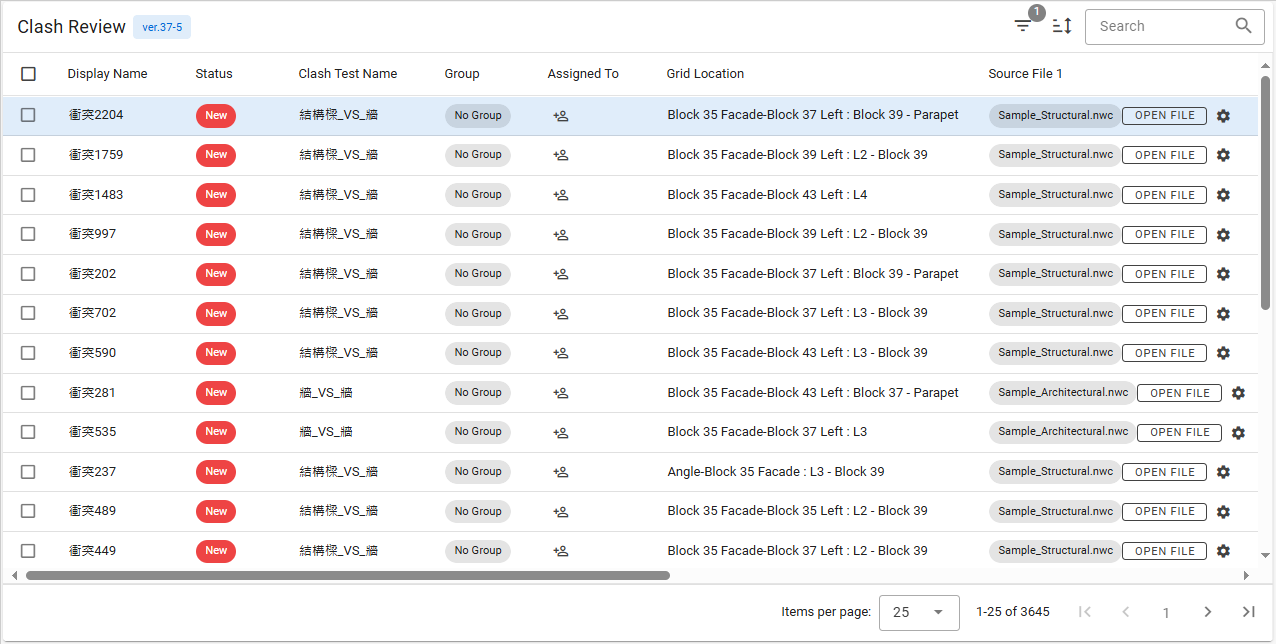
# Clash Review
Clash results assigned to the user will be listed here.
In the project menu, click [ BIM ] [ Clash Review ] to open.